
Current Lake Conditions
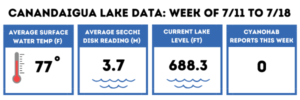
This week was hot until a very windy Thursday blew in some cooler air to end the week. The lake has heated up and turned a light green. Secchi disc readings fell below 4 meters (about 13 feet) indicating decreased water clarity from last week. Water temperature at beaches and docks have gotten over 80 degrees.
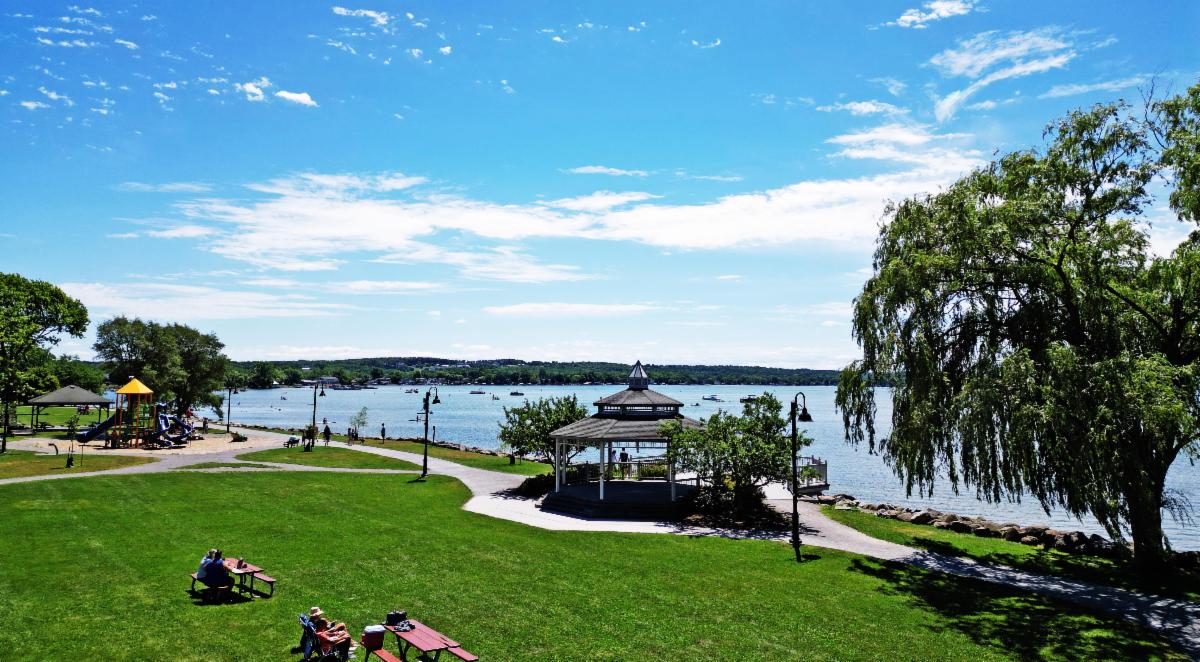
Friday (today!) was a gorgeous day down at the lake. Lots of people enjoying the blue skies and slightly cooler – but still plenty warm – weather.
Lake Temp
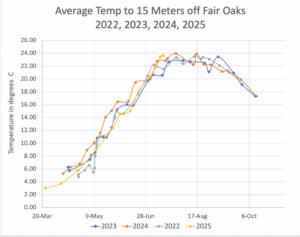
CLWA’s temperature at depth project shows that average temperature to 15 meters (about 50 feet) has increased, making up for a cool May and at this stage 2025 is slightly warmer than the last few years.
It Takes a Village
There are many people involved in monitoring the lake to help inform our community and collecting data to support management decisions and actions.
Our CLWA volunteers are:
- monitoring shorelines all around the lake and keeping an eye out for any bloom conditions.
- measuring chlorophyll and phycocyanin in the lake with our new YSI probe – two parameters to determine how much cyanobacteria is in the water.
- using ioLight microscopes to look at water samples and see when microsystis – a common cyanobacteria in our lake – is present.
Staff from the Watershed Council (CLWC) and FLCC are collecting important data all summer as well as part of their long term monitoring program. They are also doing plankton tows and taking fluoroprobe measurements to confirm the composition of the phytoplankton in the water. It’s all hands on deck with many organizations all working together to protect the lake!
What’s in the water right now?
Recent fluoroprobe results from CLWC and FLCC show that green algae and diatoms are currently dominating the water column, which explains the green color many people have noticed. These algae are common in lakes and do not produce toxins or harmful algal blooms (cHABs).
Our CLWA volunteers have also been monitoring for pigments linked to cyanobacteria—the organism responsible for HABs—using our YSI probe. So far, levels remain low, confirming that green algae and diatoms are the main players right now.
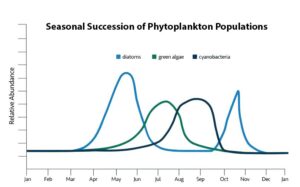
Diatoms typically dominate early in the season, followed by green algae, and then cyanobacteria, and then the diatoms come back at the end of the season again. This is a generalized graphic of relative algal abundance over time for a typical low to medium productive lake such as Canandaigua. As you can see – we would expect to see green algae and diatoms right about now.
Collecting Data: How a fluoroprobe works
Fluoroprobes are used in the field to measure chlorophyll and blue-green algae in water by detecting their fluorescence. These sensors shine a specific wavelength of light—usually from an LED or laser—onto the sample.
The light excites molecules (called fluorophores) and the electrons in the fluorophores move to a higher energy state. As the electrons return to ground state, they release excess energy as fluorescence, which a photodetector in the sensor measures.

Why Wavelengths Matter in Algae Detection
Fluorometers measure substances based on their unique light “signature.” Each has specific excitation and emission wavelengths: a high-energy, short-wavelength light excites the substance, and a lower-energy, longer-wavelength light is emitted as fluorescence.
For chlorophyll-a—the most common form of chlorophyll—fluorometers typically use blue light (~470 nm) for excitation. The chlorophyll then emits red light in the 650–700 nm range, which the sensor detects to measure algae levels. This is the science we all learned the basics of in middle school – and makes for a great jeopardy question for sure! (image and content sourced from Nexsens Technology – Click here to learn even more about measuring chlorophyll and cyanobacteria)
Stay informed so you can enjoy Canandaigua – or other New York Lakes – safely and confidently this summer. One tool for doing just that is the online NYHABs map. Once we start having blooms reported on our lake – we also have our own map that is available on our website as well.
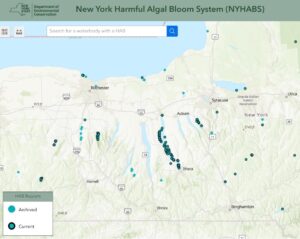
NYHABS Map
The link below leads to the NYHABS interactive map and displays the location of HABs in New York State. Each blue dot outlined in black represents a HAB reported in the past 2 weeks. There may be other waterbodies with cHABs that have not been reported to DEC. All reports through our monitoring program are shown on our own map on our website. CLWA staff uploads all cHABs report to the NYHABs database that we receive through our trained volunteers.
Remember – conditions can change rapidly. Please use caution when out on the lake and look for characteristics of CyanoHABs including water that looks like:
- Pea soup, spilled paint, surface streaks or scum
- Color’s that are typically green, blue-green or yellow but can also be brown, red or purple
- Typically found along shorelines or coves
For images and more information on CyanoHABs, refer to the section below.
The official volunteer CyanoHABs monitoring program will begin on July 25th and run through October 2nd, 2025 but we have encouraged our volunteers to still keep an eye out on conditions prior to this date and report if they suspect bloom-like conditions.
Please, to keep yourselves and pets safe, avoid any water conditions that appear to be bloom-like. Don’t hesitate to reach out to us at 585-394-5030 with any questions or email us at HABS@canandaigualakeassoc.org if you are concerned about water quality. Sending us photos of the water is strongly encouraged. Have a wonderful weekend and stay tuned.